Temperature Control with ESP8266 NODEMCU
IoT system for automatically regulating temperature using ESP8266 NODEMCU, sensors, and relay module.
REPOSITORY:
Materials:
- ESP8266 NODEMCU
- DHT11 Sensor
- 5V Relay Module
- Heat Mat for Reptiles
- Display Module


Operation:
The operation is straightforward; my intention is to regulate the temperature of an enclosed space when it is below 24 degrees Celsius. This is useful for the care of animals or for regulating plant temperatures by adding a relay module with higher voltage and amperage capacity.
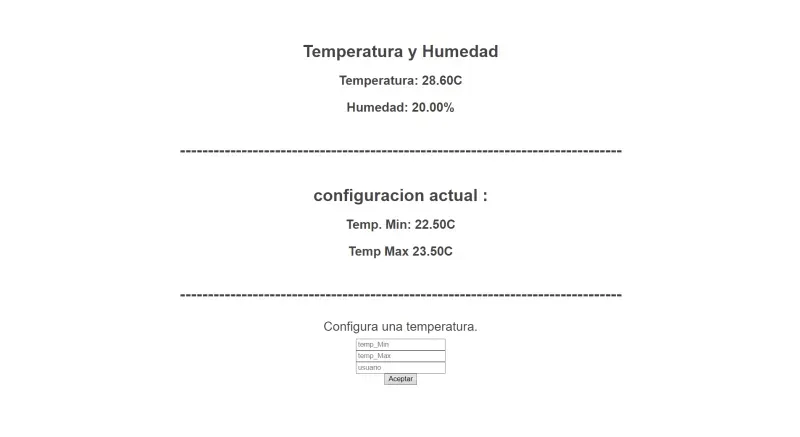
An optimal temperature range has been applied in which it is desired to operate. When the minimum temperature is reached, the relay turns on, supplying power to the heat mat. When the maximum temperature is reached, the relay turns off, cutting power to the heat mat and thus lowering the temperature. All this configuration is done from a browser.
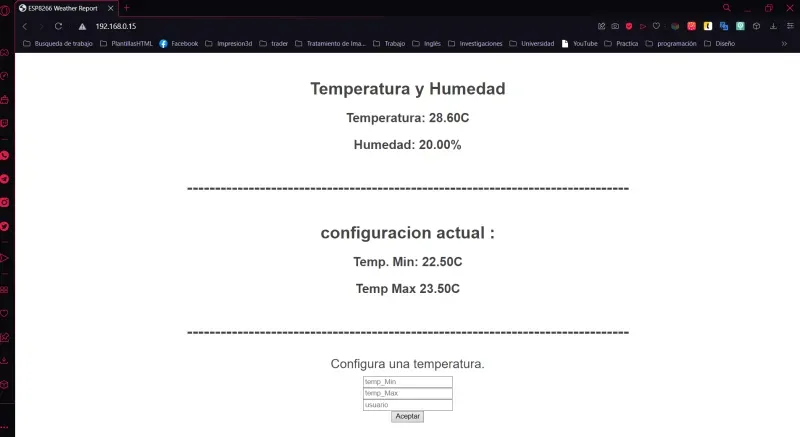
From a computer or mobile device, one can access the browser to view the current temperature and humidity in real-time, as well as the current temperature range settings. The configuration can also be modified with a minimum and maximum temperature along with a user that serves as an authenticator.
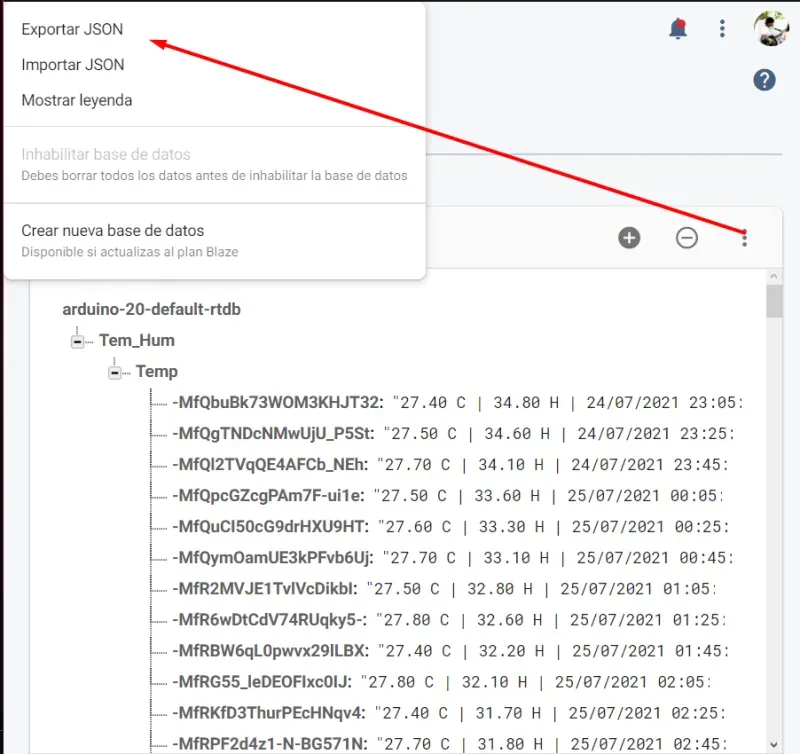
- The data is stored in the GCLOUD cloud, specifically in RealtimeDatabase.
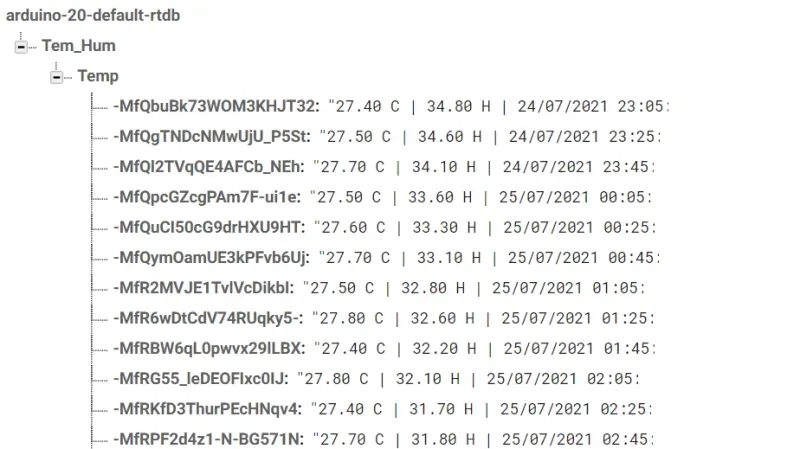
- As can be seen, the Celsius degrees, humidity, date, and time are stored. Subsequently, the data is downloaded in JSON format and regular expressions are used to work with it.
- Up to this point, the project is functioning and collecting data for monitoring.
Data Analysis
Python is used for the analysis as it allows for sorting the data and generating graphs.
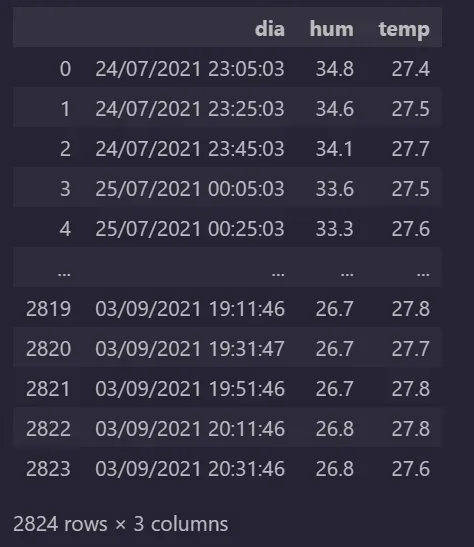
Since the information is in RAW format separated by a pipe " | ", regular expressions are used to sort the information and transform it into a dataframe with pandas.
- The temperature configuration set was a minimum of 27 degrees and a maximum of 28 degrees. After conducting a descriptive analysis of the data, it can be determined that:
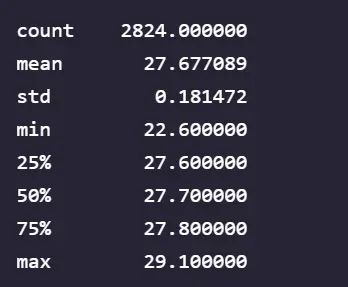
A total of 2824 data points were collected, with an average temperature of 27.67 degrees and a standard deviation of 0.18. The data shows that a minimum of 22.6 degrees and a maximum of 29.10 degrees were reached. When the data is sorted, it can be observed that 25% of the temperatures are at 27.6 degrees, 50% at 27.7 degrees, and 75% at 27.8 degrees, which is consistent.
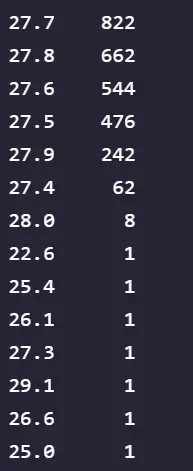
The count of data points for each temperature reached is as follows:
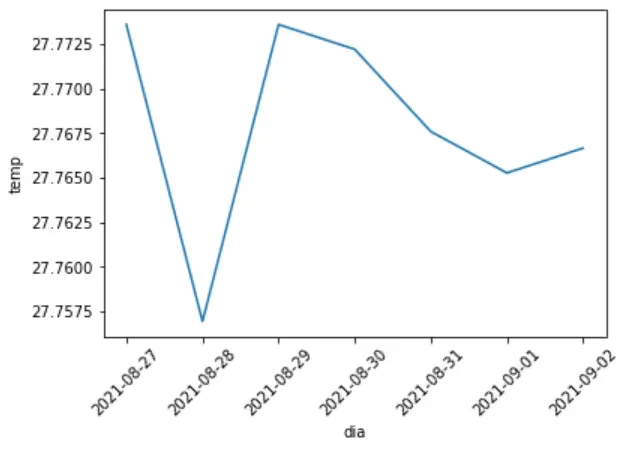
- The following graph shows the average temperature over the last 7 days.
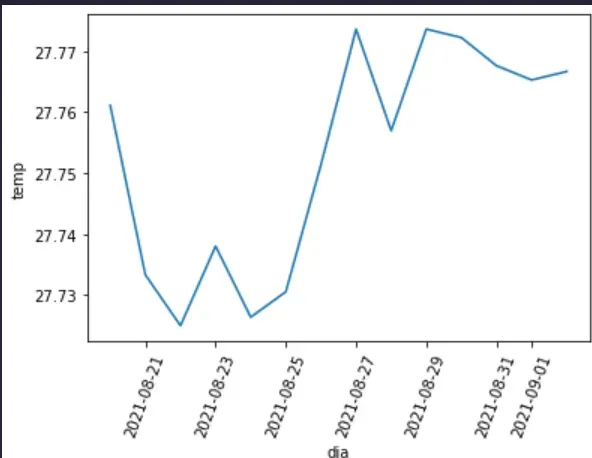
- The following graph shows the last two weeks.
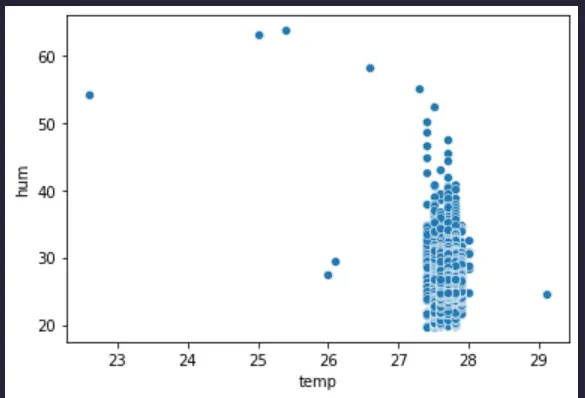
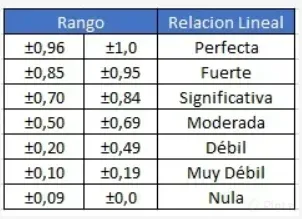
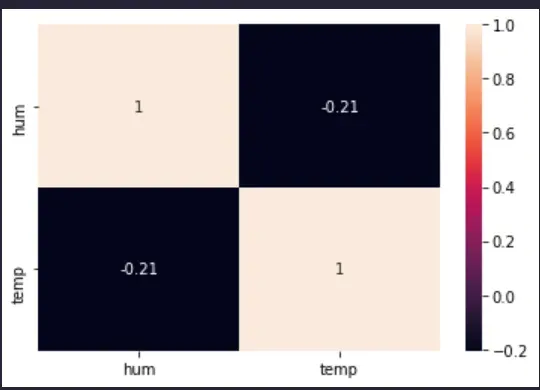
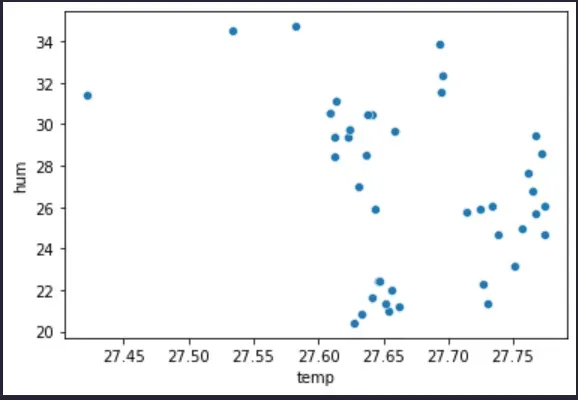
- A weak correlation between humidity and temperature can be observed.
- This fact is corroborated in the following scatter plot (average temperature and humidity per day).
- Additionally, the graph of total temperature and humidity per day is shown.