PLC Data Capture and Visualization System
Software for capturing and visualizing real-time data from PLCs, optimizing industrial monitoring and control.
Overview
My project TA (YOUR ANALYSIS) consists of developing a software system aimed at capturing real-time data from a PLC. This data includes information such as flow rate, carbon dioxide, methane, among others. The system has several components in its architecture.
System Components
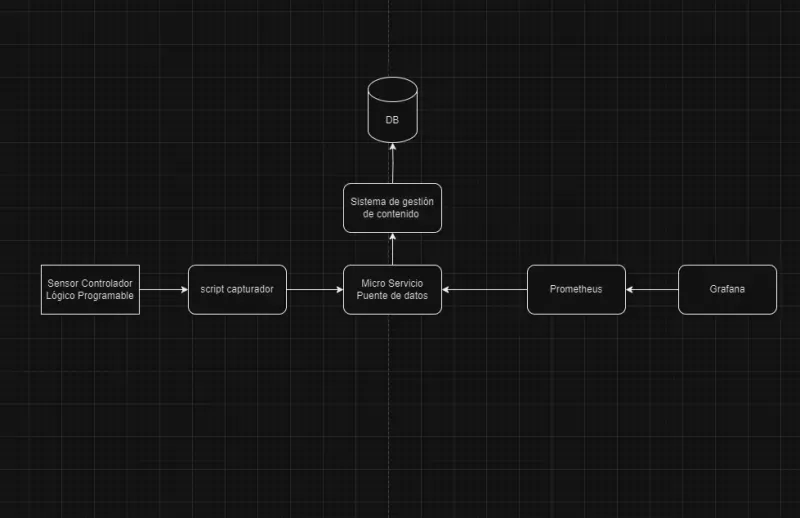
Capture Script: This script is responsible for capturing data directly from the PLC. Using specific communication protocols, such as Modbus or OPC, the script continuously collects the necessary data in real-time.
Bridge System: The bridge system is based on an API developed using Lambda Express. This API receives the data captured by the script and sends it to a content management system. Additionally, it allows requests from other systems, such as Prometheus, which extracts the stored data for later visualization in Grafana.
Content Management System: The content management system is responsible for storing the data received by the API. It uses a database to save the information in a structured manner and ensure the integrity of the captured data. This allows for efficient handling of large volumes of information and quick access to the stored data.
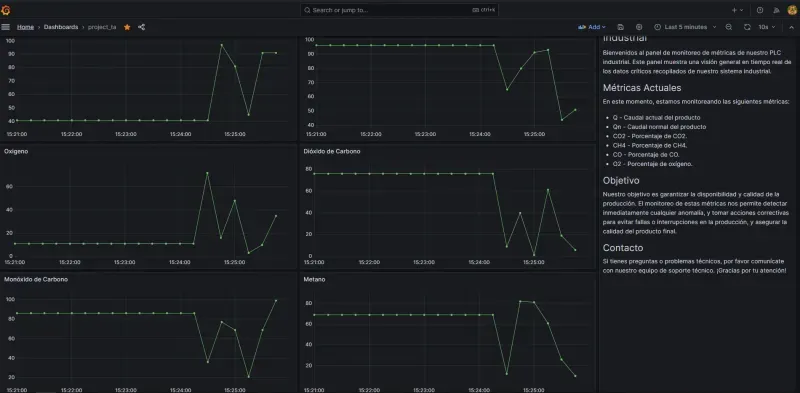
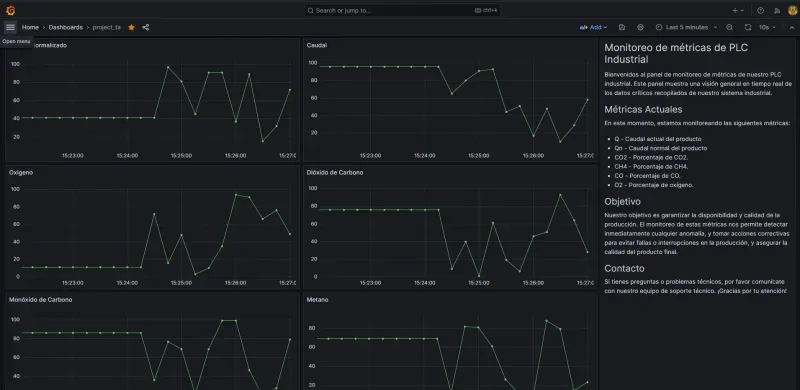
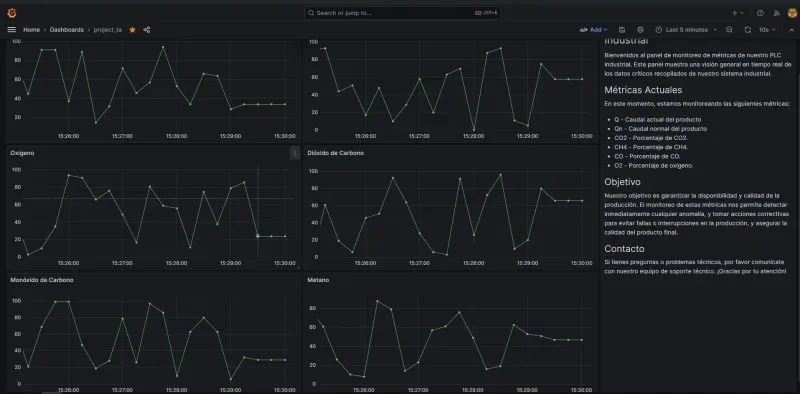
Integration with Grafana: The system integrates with Grafana, a data visualization and dashboard creation tool. The data stored in the database can be used to generate graphs and interactive panels, making it easier for the end user to interpret and analyze. This provides an intuitive and engaging way to visualize the information captured from the PLC.
Operation
Initial Configuration
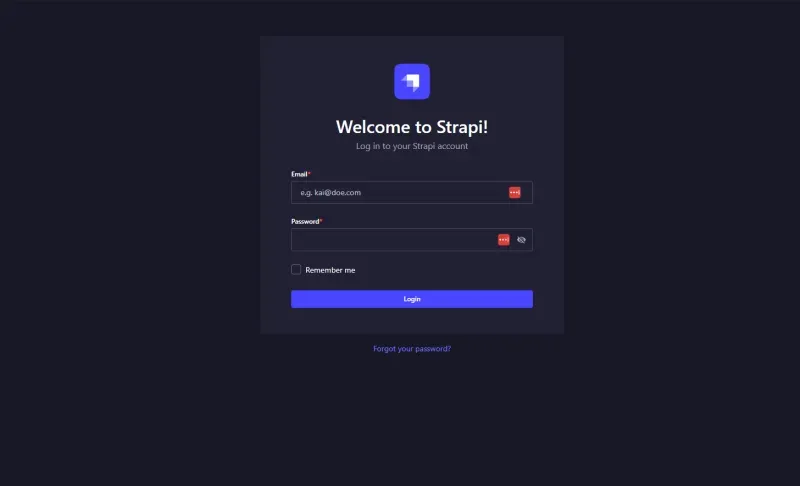
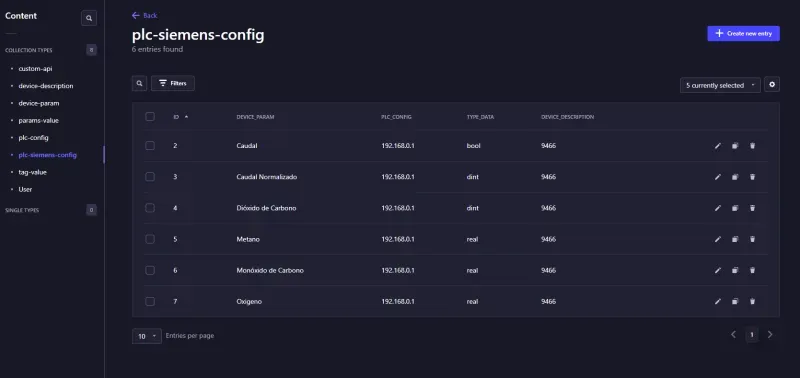
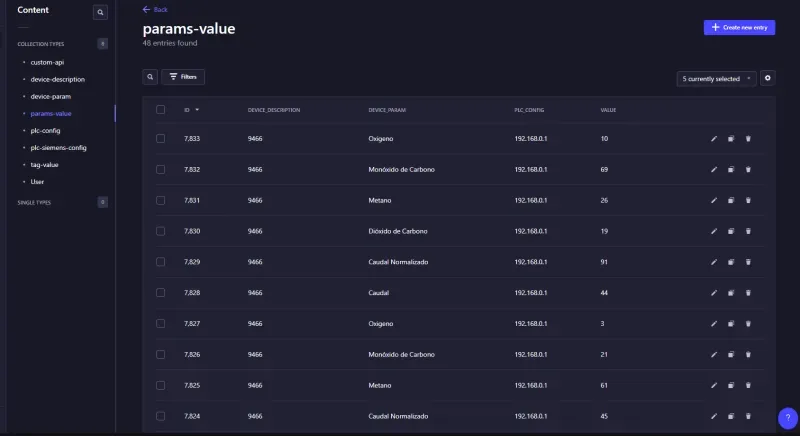
We start by configuring the values in our content management system. They are added one by one depending on what we desire.
Access the content management system.
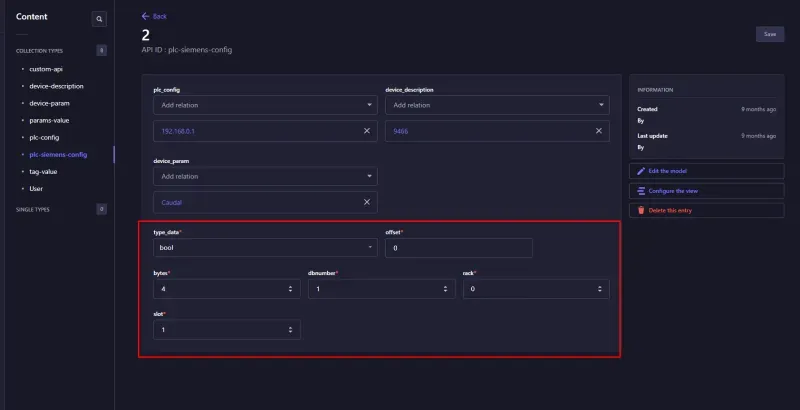
Parameter configuration.
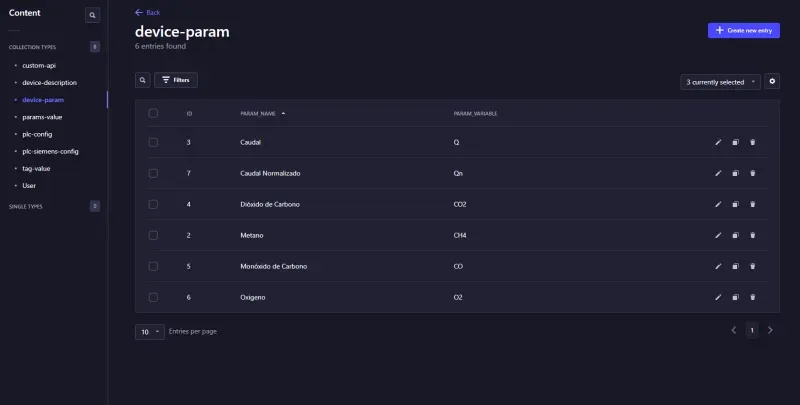
Configuration of relationships with other tables.
Add memory spaces in the PLC.
Sending random data from the script console with
[8].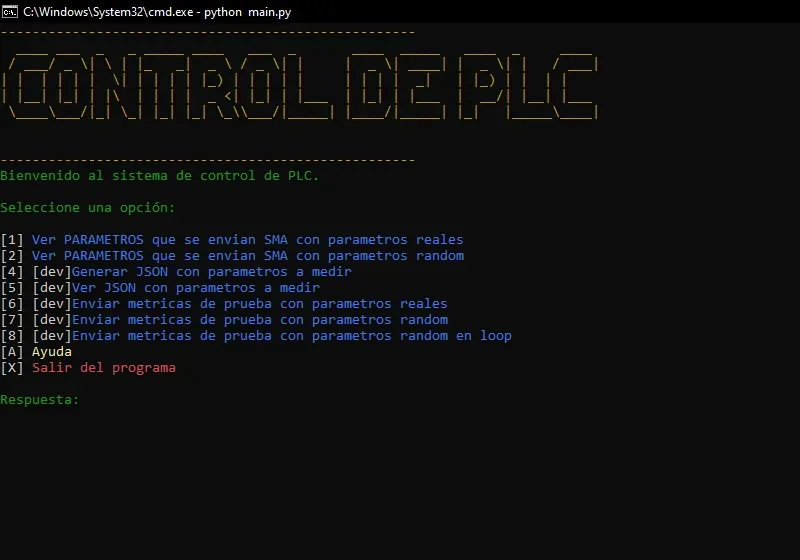
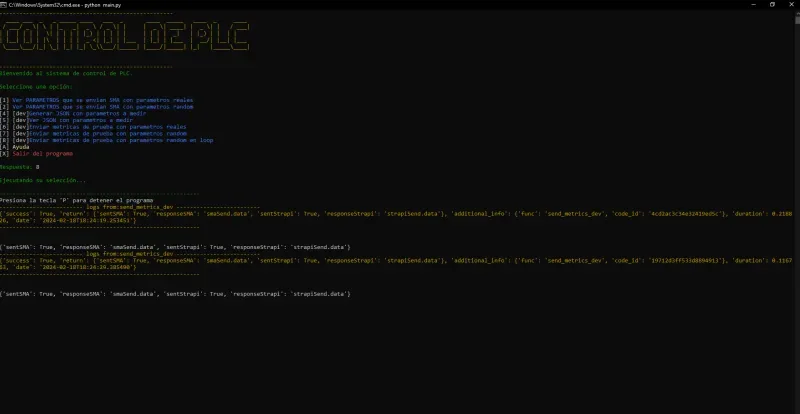
Successful execution of sending random data in a loop.
The values are stored in our database. Here it is observed.
Dashboard receiving data.
Conclusion
This software project offers a comprehensive solution for capturing data from a PLC and visualizing it clearly and attractively through Grafana. The structure of the system, composed of a capture script, a bridge system, and integration with Grafana, ensures efficient data capture and effective visual presentation. Additionally, the use of technologies such as Lambda Express and databases allows for secure and scalable management of the captured information.